
Project Schedule Management is the timetable of the Project activities. This Schedule document eloborate how the work will progress over a period of time and takes into account including resource and estimation.
The Project Time Management Processes are:
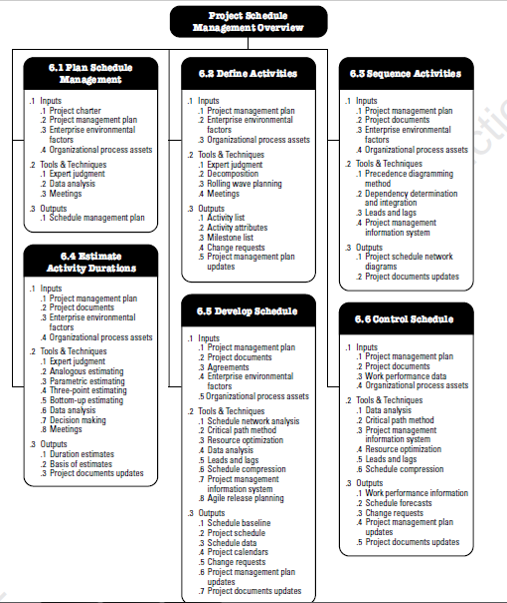
Key Concepts:
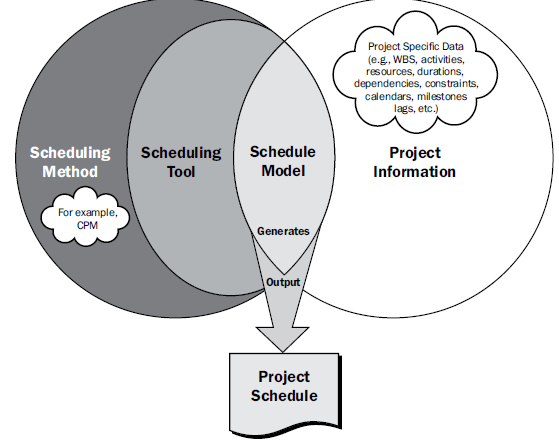
Project Management team selects a scheduling method such as critical path or Agile aproach. Then the Project Specific data, such as activities, planned dates, duration, resources, dependencies, and constraints, are enter into a schedule tool to create a schedule model for the project. The result in project schedule Figure 6.2 provides a scheduling overview that shows how the scheduling method, scheduling tool and output from the project schedule management process interact to create a schedule model.
Plan Schedule Management
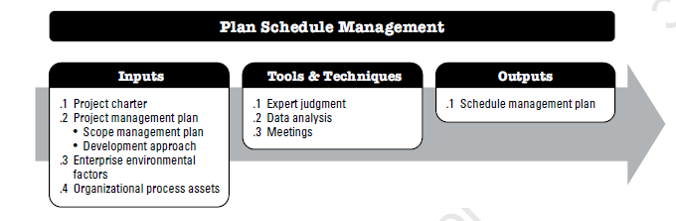
Plan Schedule Management is the process of establishing the policies, procedures, and documentation for planning, developing, managing, executing, and controlling the project schedule.
The key benefit of this process is that it provides guidance and direction on how the project schedule will be managed throughout the project.
The Schedule Management Plan outlines the criteria for developing, monitoring, and controlling the project schedule.
The Schedule Management Plan can establish the following:
Define Activities of Schedule Management:
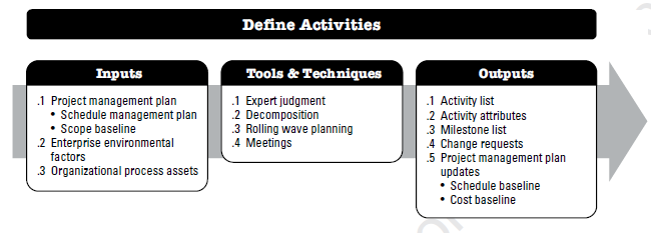
Define Activities is the process of identifying and documenting the specific actions to be performed to produce the project deliverables.
The key benefit of this process is to break down work packages into activities that provide a basis for estimating, scheduling, executing, monitoring, and controlling the project work.
Define Activities Tools:
Decomposition
Rolling Wave Planning
Rolling wave planning is an iterative planning technique in which the work to be accomplished in the near term is planned in detail, while the work in the future is planned at a higher level. It is a form of progressive elaboration.
Define Activities - Outputs:
Activity List - The activity list is a comprehensive list that includes all schedule activities required on the project.
Activity Attributes - Activity attributes extend the description of the activity by identifying the multiple components associated with each activity eg. the activity identifier (ID), WBS ID, and activity label or name, activity description, predecessor activities, successor activities, logical relationships, leads and lags, resource requirements, imposed dates, constraints, assumptions and apportioned effort etc.
Milestone List - A milestone is a significant point or event in a project. A milestone list is a list identifying all project milestones and indicates whether the milestone is mandatory, They have zero duration because milestones represent a moment in time.
Sequence Activities of Schedule Management:
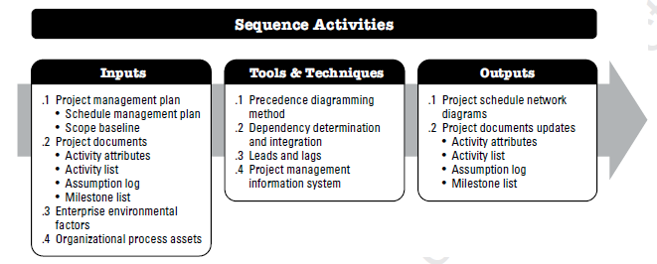
Sequence Activities is the process of identifying and documenting relationships among the project activities.
The key benefit of this process is that it defines the logical sequence of work to obtain the greatest efficiency given all project constraints.
Sequence Activities - Tools
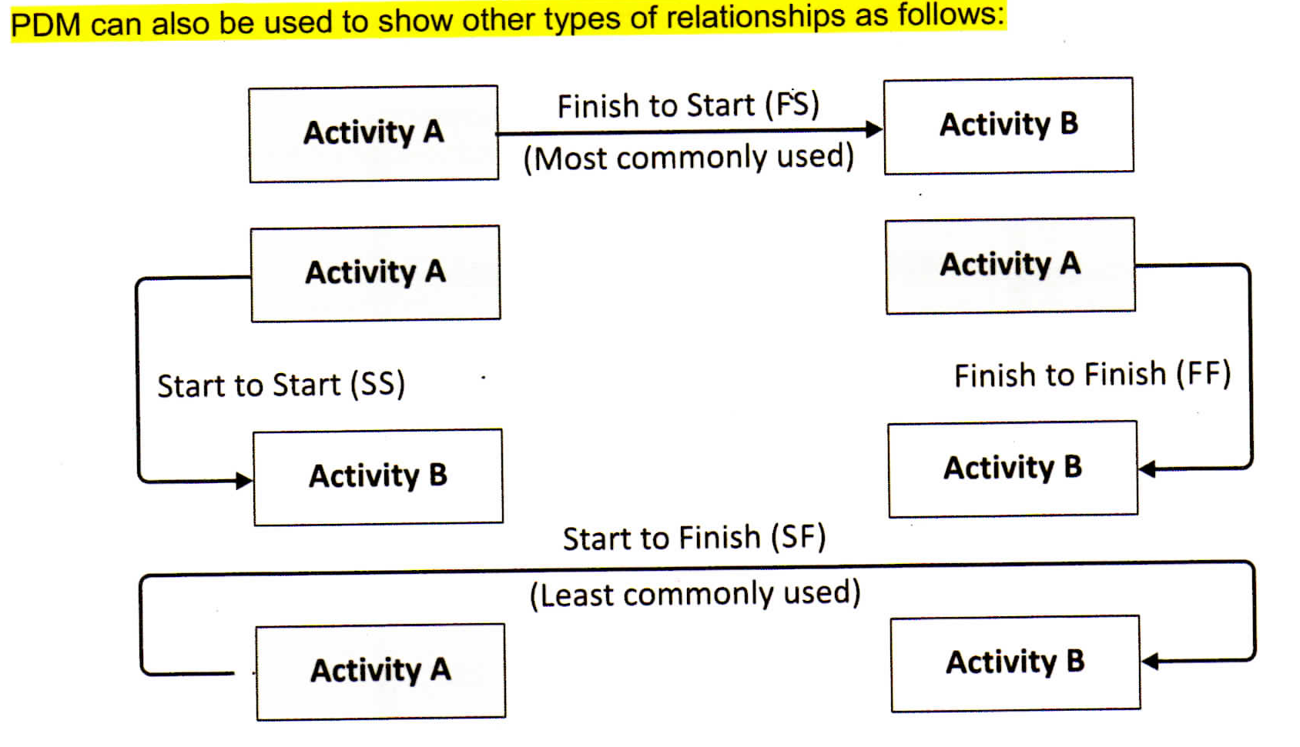
The precedence diagramming method (PDM) is a technique used for constructing a schedule model in which activities are represented by nodes and are graphically linked by one or more logical relationships to show the sequence in which the activities are to be performed.
PDM includes four types of dependencies or logical relationships.
Example: The awards ceremony (successor) cannot start until the race (predecessor) has finished.
Example: Writing a document (predecessor) is required to finish before editing the document (successor) can finish.
Example: Level concrete (successor) cannot begin until pour foundation (predecessor) begins.
Example: The first security guard shift (successor) cannot finish until the second security guard shift (predecessor) starts.
Dependencies can be either mandatory or discretionary, internal or external; or a combination of each (e.g., mandatory external):
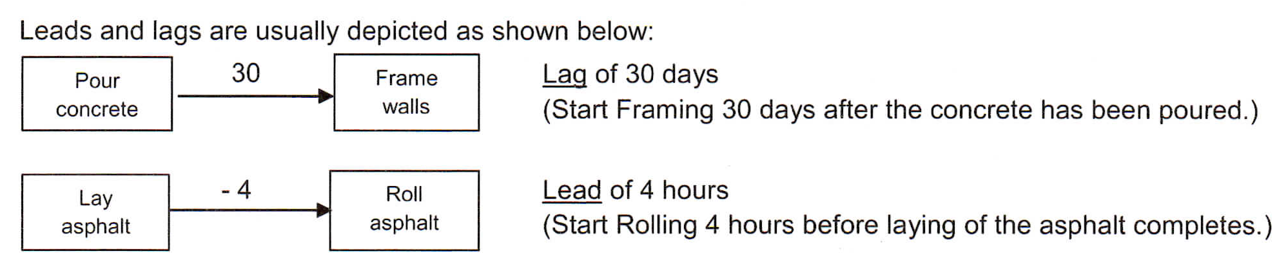
Leads and Lags
Sequence Activities - Outputs
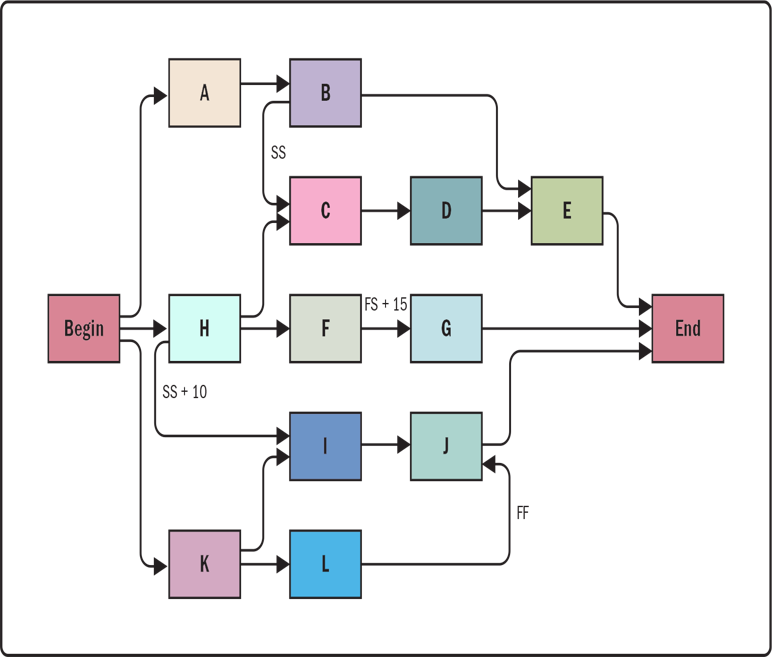
Project Schedule Network Diagrams
A graphical representation of the dependencies among the project schedule activities. A summary narrative can accompany the diagram and describe the basic approach used to sequence the activities.
Project Documents updates
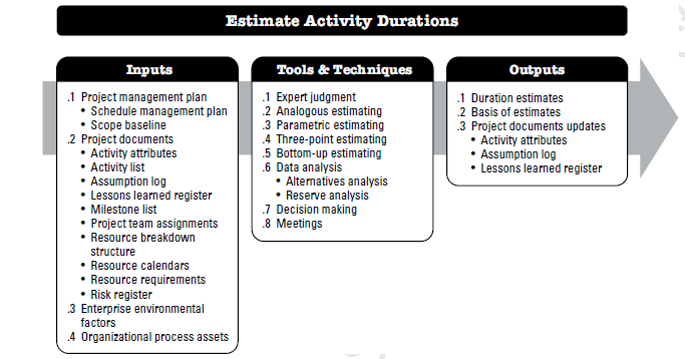
Estimate Activity Durations
Estimate Activity Durations is the process of estimating the number of work periods needed to complete individual activities with estimated resources.
The key benefit of this process is that it provides the amount of timeeach activity will take to complete, which is a major input into the Develop Schedule process.
Factors for consideration while estimating Activity Duration
Estimate Activity Durations - Tools
In Analogous or Top-down Estimating we use actual durations from a previous project documented in the Organizational Process Assets as the basis for estimating durations for the current project. Analogous estimating is usually less costly and time consuming than other techniques, but it is also usually less accurate.
You realize that there may be some material delays, so you ensure there are buffers or contingency reserves for some activities to account for this risk. This is known as Reserve Analysis. Contingency reserves are included in the project baseline.
Use of parameters and mathematical calculations for estimating is called Parametric Estimating.
We also involve the team in the estimating process through the use of Group Decision-Making Techniques like brainstorming, nominal group technique, and the Delphi technique.
To get a better estimate we come up with Pessimistic, Most likely, and Optimistic values which you can use to calculate a Three-point Estimate using the PERT formula . This helps account for estimation of uncertainty and risk.
Program Evaluation and Review Technique (PERT) Calculations
PERT is an estimating technique used to determine a weighted average by using pessimistic, most likely, and optimistic values to address activity duration and cost estimating uncertainties.
Let us assume that a project has two tasks, Task A and Task B, with the three-point estimates shown below:
|
Task |
Optimistic |
Most Likely |
Pessimistic |
PERT (P + 4M + O) |
Standard Deviation (P - O)/6 |
Variance {(P - O)/6}2 orSD2 |
|
6 |
||||||
|
Task A |
3 |
4 |
5 |
4 |
0.33 |
0.11 |
|
TaskB |
5 |
6 |
13 |
7 |
1.33 |
1.77 |
Estimate Activity Durations - Outputs
Activity Duration Estimates
Activity duration estimates are quantitative assessments of the likely number of time periods that are required to complete an activity. Duration estimates do not include any lags. Activity duration estimates may include some indication of the range of possible results.
For example:
2 weeks ± 2 days, which indicates that the activity will take at least eight days and not more than twelve (assuming a five-day workweek); and 15 % probability of exceeding three weeks, which indicates a high probability—85 %—that the activity will take three weeks or less.
Develop Schedule in Project Schedule Management
Various diagrams that can be used to depict the Project Schedule:
What is the Critical Path?
The Critical Path is the longest path in the diagram. There can be more than one critical path. Multiple critical paths represent more risk to the project schedule.
Why do we calculate the Critical Path?
It helps us determine the longest path(s) in our project which is the minimum amount of time needed for the project's completion‘
Total Float is the amount of time a schedule activity can be delayed or extended from its early start date without delaying the project finish date or violating a schedule constraint.
The Total Float (also referred to as just float or slack) of any activity on the Critical Path is usually 0 (zero). Total Float is calculated for every activity in the network diagram to determine the amount of schedule flexibility each activity has.
Free Float is the amount of time that a schedule activity can be delayed without delaying the early start of any successor or violating a schedule constraint.
Project Float is the total amount of time that the project can be delayed without delaying the externally imposed project completion date required by the customer or sponsor.
Critical Path Method (CPM) involves calculating the theoretical early start (ES) and early finish (EF) dates, and late start (LS) and late finish (LF) dates for all schedule activities. We do a forward pass to determine early dates followed by a backward pass to determine late dates.
Critical Chain Method
Critical chain method allows modify the schedule by adding buffers to activities is on the Critical Path to account for resource uncertainties that could affect the project schedule.
A project buffer at the end is added to protect the target end date for the project.
Critical Chain Method focuses on managing buffer durations, rather than floats.
Develop Schedule Tool - Modeling Techniques
Develop Schedule - Outputs
Schedule Baseline
A schedule baseline is the approved version of a schedule model that can be changed only through formal change control procedures and is used as a basis for comparison to actual results.
Project Schedule
The outputs from a schedule model are schedule presentations. The project schedule is an output of a schedule model that presents linked activities with planned dates, durations, milestones, and resources
Bar charts. These charts, also known as Gantt charts, represent schedule information where activities are listed on the vertical axis, dates are shown on the horizontal axis, and activity durations are shown as horizontal bars placed according to start and finish dates
Milestone charts. These charts are similar to bar charts, but only identify the scheduled start or completion of major deliverables and key external interfaces.
Project schedule network diagrams. These diagrams are commonly presented in the activity-on-node diagram format showing activities and relationships without a time scale, sometimes referred to as a pure logic diagram
Schedule Data
The schedule data for the project schedule model is the collection of information for describing and controlling the schedule.
The schedule data includes at least the schedule milestones, schedule activities, activity attributes, and documentation of all identified assumptions and constraints.
Project Calendars
A project calendar identifies working days and shifts that are available for scheduled activities. It distinguishes time periods in days or parts of days that are available to complete scheduled activities from time periods that are not available.
Control Schedule of Project Schedule Management:
Control Schedule is the process of monitoring the status of project activities to update project progress and manage changes to the schedule baseline to achieve the plan.
The key benefit of this process is that it provides the means to recognize deviation from the plan and take corrective and preventive actions and thus minimize risk.
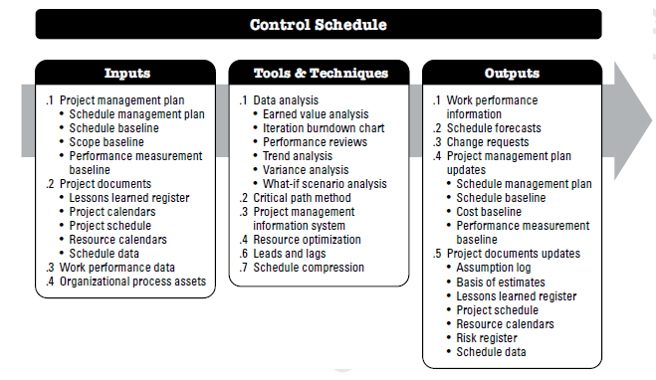
Control Schedule - Tools
Performance Reviews
Performance reviews measure, compare, and analyze schedule performance such as actual start and finish dates, percent complete, and remaining duration for work in progress. Various techniques may be used, among them:
Trend analysis.
Trend analysis examines project performance over time to determine whether performance is improving or deteriorating. Graphical analysis techniques are valuable for understanding performance to date and for comparison to future performance goals in the form of completion dates.
Earned value management
Schedule performance measurements such as schedule variance (SV) and schedule performance index (SPI), are used to assess the magnitude of variation to the original schedule baseline.
Please follow the link to know more details about PMP Certification training or contact us at 9176689355 / 9566008068.

